2019 Estuary Survey
This year’s topographic survey was completed using Photogrammetry and a sUAS (aka Drone). We achieved an excellent absolute accuracy using this process along with about a dozen RTK surveyed Ground Control Points (thank you Conor Shae of the USFWS). In addition to a much more accurate survey, we also reduced costs as compared with a more traditional total station survey like we did in the past. The Estuary is ideal for drone mapping missions as the terrain is fairly flat and open. A total of nine flights at 300 feet altitude AGL (Above Ground Level).
We conduct surveys as often as possible to collect the following data:
- Topography of the estuary
- LWD survey to identify large wood placed with a helicopter in 2013 & 2016
- All placed wood had pit tags installed so we are now able to scan those tags to identify pieces of wood and track their movement
- Bathymetric survey to identify pools and collect pool data
Download the Draft Final Report
A draft report was completed and is available for download here.
Overview and Intent of Proposed Action
Restoration of fish habitat in the Mattole River estuary requires a comprehensive multi-year approach. The approach presented here is driven by a set of biological objectives, which, in turn, are controlled by various physical processes at work in the lower Mattole River.
The biological objectives of this effort are to:
- Improve juvenile salmonid survival during summer, low-flow periods
- Increase availability of suitable winter rearing habitat, with emphasis on juvenile coho salmon winter refuge habitat.
To accomplish these objectives, this five-year strategy seeks to integrate our understanding of the dynamic nature of the lower river by identifying a suite of physical river features for treatment.
The intent of these treatments has several physical objectives:
- Increase channel stability in the lower Mattole River
- Increase instream habitat complexity
- Promote riparian vegetation colonization and growth
- Create a mosaic of varying streambed sediment sizes
- Promote more variable topographic diversity in the reach
- Increase connectivity to existing sloughs, alcoves, and other off-channel habitat
- Increase stream nutrients available to native species
Finally, recognizing the dynamic setting of the lower Mattole River and our ever-improving understanding of riverine processes, the proposed action is intended to be adaptive. The adaptive elements of the plan are described in detail at the end of the proposed action section.
Three specific types of projects are proposed here: placing structures on islands; installing structures at the apex of river bars; treatments along the margins of river terraces; and re-connecting a slough channel to the estuary. The specific treatment locations and types are described in detail below.
Monitoring Background
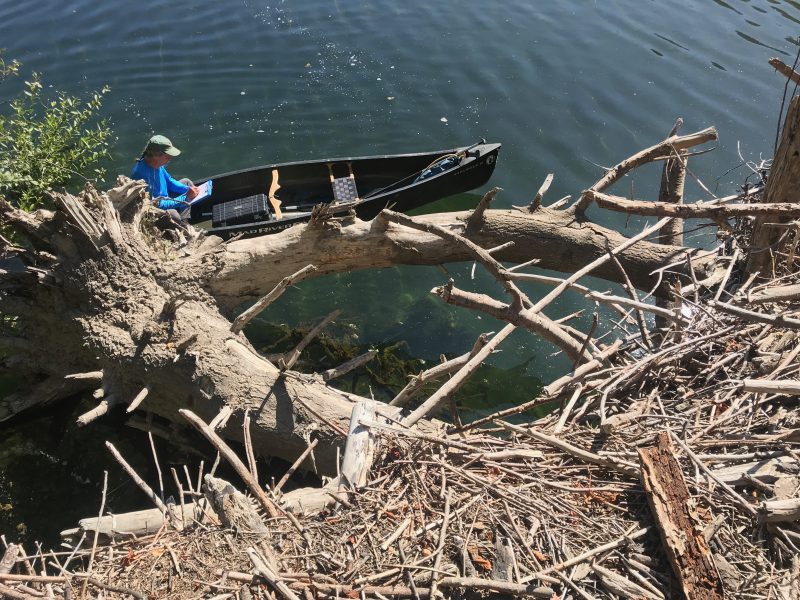
This follows monitoring work done in 2014, summer 2017, and now again in summer 2019. The 2019 survey was completed by Josh Madrone and Sungnome Madrone. A drone was used for topographic and bathymetric information combined with ground surveys of pool length, width, and depths, and locations of large wood/whole trees.
Previous Surveys
The two previous surveys were done by Total Station ground surveys, to survey features such as large wood/whole trees, stream barbs, structures, pools, and major topographic breaks. The 2014 survey was completed by Keith Barnard, Sungnome Madrone, and ________________. The 2017 survey was completed by Keith Barnard, Sungnome Madrone, Josh Madrone, and Brandon Madrone.
Survey Dates
The 2014 survey was completed in October, between the 7th and 30th. The flow at time of getting pool data was ~20 CFS. In 2017 we surveyed once around the 19th of May and again on the 1st of June. The flow at that time was between 240-380 CFS. In 2019 we surveyed on June 7th and again on September 13th. Pool data was collected with a flow of ~35 CFS.
Table 1. Survey dates and river flow
|
Year |
Survey dates |
River flow (CFS) |
Comments |
|
2014 |
October 7 |
20 |
Pools |
|
October 30 |
110 |
LWD |
|
|
2017 |
March 13-14 |
1200 |
LWD |
|
May 17-19 |
400 |
Pools 1-16 |
|
|
June 1-2 |
250 |
Pools 17-19 |
|
|
2019 |
June 7 |
340 |
LWD |
|
September 13 |
35 |
Pools 1-14 (all) |
Report Focus
This report will focus on the monitoring results from the summer 2019 survey for tree locations after 3-6 years of flows and rearrangement of large wood, as well as the location of pools in this lower river reach/estuary.
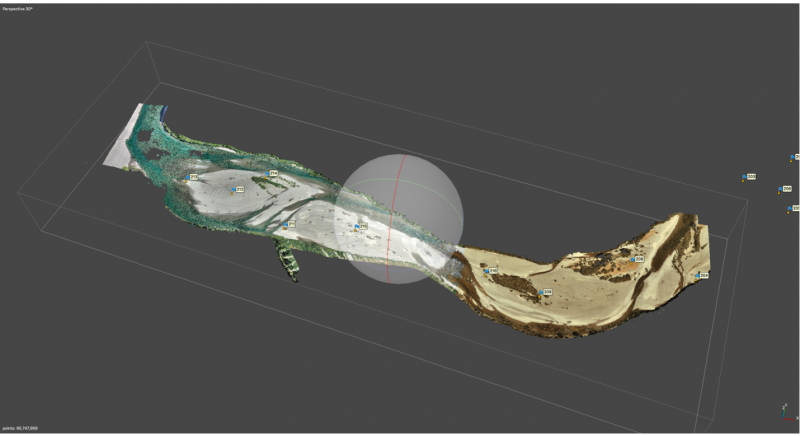
UAV Mapping (Photogrammetry)
Photogrammetry is the science of obtaining reliable measurements from photographs and digital imagery. The 2019 aerial imagery was collected with an Unmanned Aerial Vehicle (UAV) – DJI Phantom 4 Pro v2 – with a 20 Megapixel camera, flying ~300 ft Above Ground Level (AGL). The resulting photos were processed in Agisoft MetashapePro v1.6.0 to create 3D spatial data to be used in GIS applications. The two primary outputs that were created and exported are a georeferenced orthomosaic, commonly used in geographic information systems (GIS) as a “map accurate” background image, and Digital Surface Model (DSM), which gives you the height of the objects that are on the surface of the earth. These files are saved in the most-GIS-compatible GeoTIFF format. Ground Control Points (GCP) were surveyed with RTK GPS by Connor Shae of USFWS, which were used in the reconstruction of the model, with a few saved for check points to measure the accuracy of the finished model.
This year’s topographic survey was completed using Photogrammetry and a sUAS (aka Drone). We achieved an excellent absolute accuracy using this process along with about a dozen RTK surveyed Ground Control Points (thank you Conor Shae of the USFWS). In addition to a much more accurate survey, we also reduced costs as compared with a more traditional total station survey like we did in the past. The Estuary is ideal for drone mapping missions as the terrain is fairly flat and open. A total of nine flights at 300 feet altitude AGL (Above Ground Level).
A draft report was completed and is available for download here.
Treatments Implemented
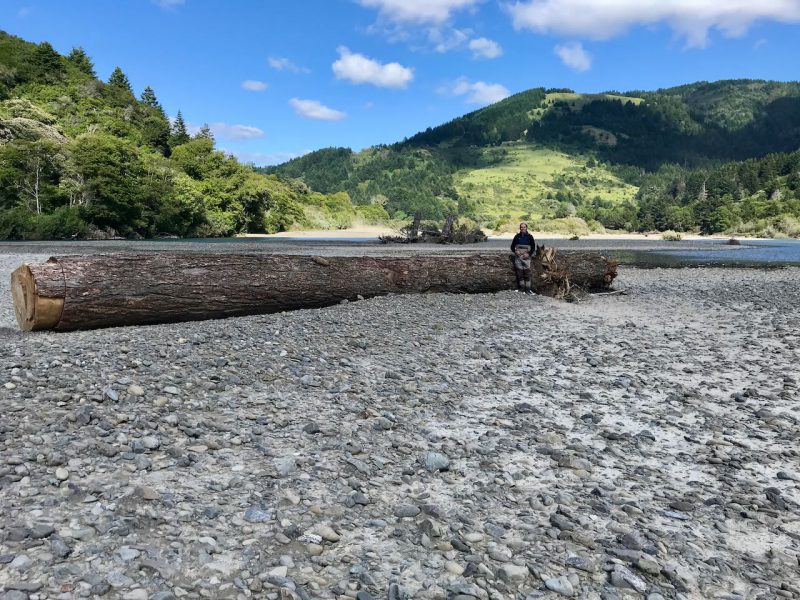
In Fall 2013 and again Fall of 2016 hundreds of whole trees were put into the estuary. Details are included in the Final Reports for those projects.
The 2016 helicopter wood placement component for this 2016 work included the following numbers of whole trees placed:
Table 2 – 2016 wood placement stats
|
Area L-1 |
12 pcs |
|
Area L-2 |
9 pcs |
|
Area R-1 |
9 pcs |
|
Area R-2 and R-3 |
31 pcs |
|
Area R-4 |
22 pcs |
|
Area R-5 |
11 pcs |
|
Woodzilla 2 |
9 pcs |
|
Total |
103 pcs |
A total of 103 pieces placed in-stream, at terrace margins, or on the right bank (nearly all were Whole-trees, with boles and integral root wads). Plus, approximately another 150 pieces were delivered to the south-side terrace — to sites L-3 and L-4, located upstream from the 2013 project area — and subsequently used for stream barbs (small to medium-sized trees, some without root wads). Trees were tipped on-slope with an excavator and placed in the river by helicopter. Total acres of riparian area treated was 20. Over 2000 15-foot long willow cuttings were planted in the deep trenched baffles.
We constructed 30 stream barbs with 160- 60 to 80-foot-long trees that were 16-36” in diameter with root wads and limbs. The total trench length was 2740 feet with 3,340 willow cuttings 15- 20 feet long and multi branched. The stream barbs treated 2010 feet of stream bank. This approach uses a bio-technical terrace margin treatment designed to increase bank resistance to erosion. The trenches were placed at about a 30-degree angle downstream with the flow and about 50-70 feet apart. The trenches were excavated 15-20 feet deep to the summer water table so that the cuttings were placed in water immediately after being cut. After backfilling the trenches, the area was regraded and mulched.
Monitoring Program
After tree placement was complete, the Mattole Salmon Group implemented a monitoring program to answer the question,” Which trees moved, under what size flows, and where.” This monitoring program involved placing a Passive Identification Tag (PIT) into each whole tree. A hole was drilled with a cordless drill at 4’ above root wad. The hole was drilled towards the center of the log, and at a depth to put the tag ½ inch under the cambium. The tag was inserted into the tree (see figure 5). Silicone calk was used to seal the hole and secure the tag. Trees with greater than 16” diameter got two tags, on opposite sides of the tree. Additional information was collected about size (total length and diameter at breast height (DBH), species and complexity for each tree and associated with the trees individual number. Using a total station all trees were marked in their orientation on the landscape.
The total station work gave us an as built map of the entire project site with one (1) foot contour intervals.
Two re-surveys have taken place since the project began. One in the spring of 2014, and another in the Spring of 2017. Re-surveys involve scanning the tree PIT tags and using GPS to locate each tree on the project map. This shows which trees have moved and to where. We used a total station to re-map terrain elevations after many significant high flows (over 25,000 CFS) during 2016-2017.
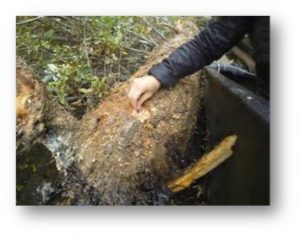
FIGURE 4 – A PASSIVE IDENTIFICATION TAG (PIT) TAG IS INSERTED INTO TREE 4’ ABOVE ROOTWAD
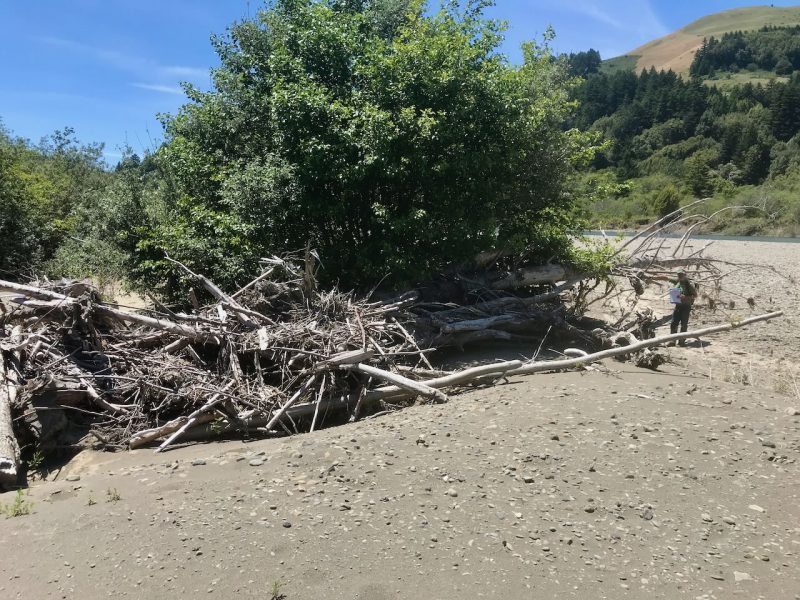
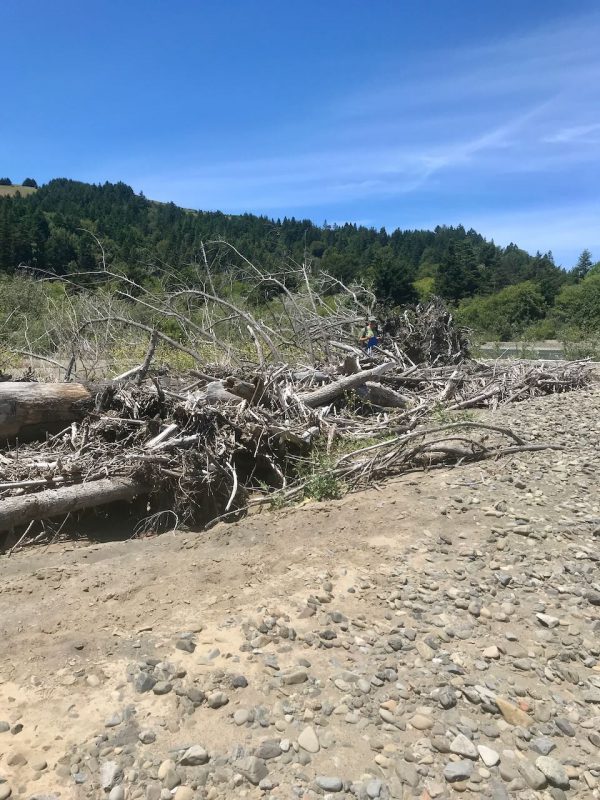
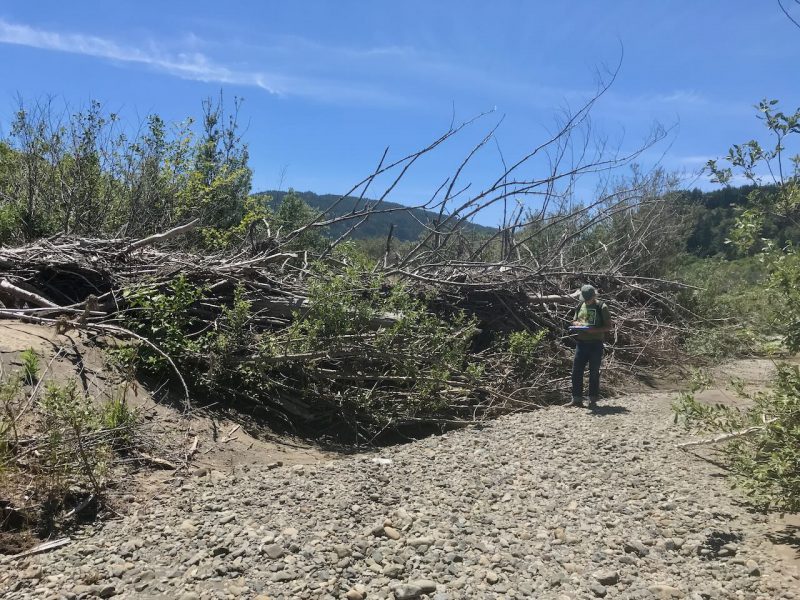
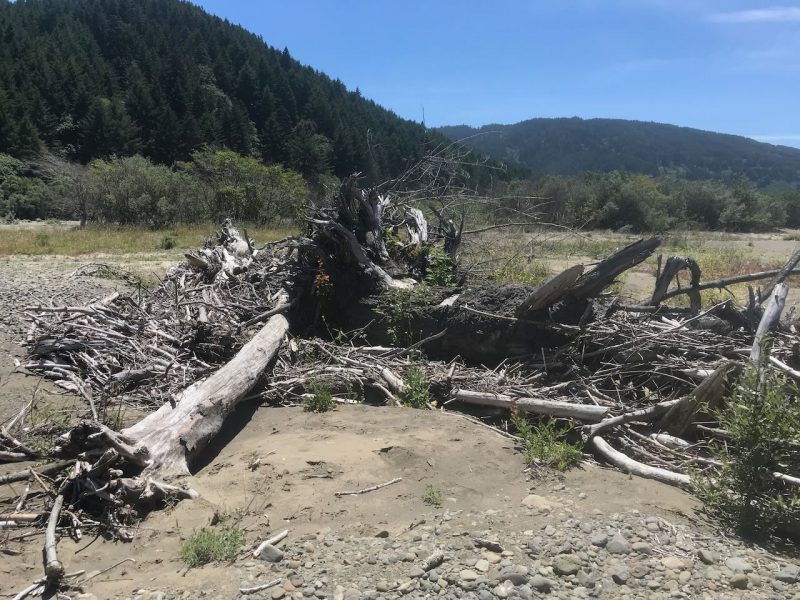
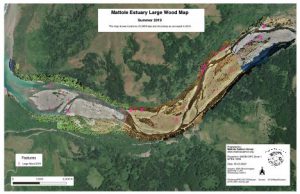
Large Wood / Whole-Trees
The 2019 large wood survey found 64 pieces of large wood.
However, the actual number is greater because there are multiple structures with multiple pieces of large wood in them, which were recorded as a single piece (eg. Woodzilla 2 structure is 9 whole-trees).
Pools
In 2012 there were 8 pools 3-5 feet deep in the treatment reach. After the placement of the 2013 and 2016 heliwood trees, and after high flows of 2016/2017, there were 20 pools that were 5-12 feet deep in the same reach. All pools were in close association with the placed heliwood.
In 2019 there were 14 pools that were 4-10 feet deep (see Figure 7) It should be noted that a more restrictive definition for pools was implemented in 2019, which if used in previous surveys would have resulted in fewer pools. One goal in 2019 was to standardize definition of pools going forward to be able to easily replicate in the future.
Pool Definition
For our purposes, Pools are defined as a small part of the reach with reduced velocity, little surface turbulence and deeper water than surrounding areas. To be considered a pool for this survey, the maximum depth at the deepest point was a minimum of 4 feet. Additionally, pools have the following characteristics:
-
- a surface slope of 0%,
- a hydraulic control,
- a maximum pool depth >=4 ft, and
- often form around boulders or large woody debris,
Table 3 – 2019 Pool Measurements
|
||||||||||||||||||||||||||||||||||||||||||||||||||||||||||||||||||||||||||||||||
Pool locations are shown in Figure 7. Full size maps are available on the file server as geo-referenced PDFs ready to print at full-resolution up to Tabloid size (11×17).
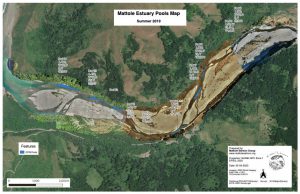
FIGURE 7 – MAP OF POOLS IN SUMMER 2019
The final map (see figure 8) shows large wood as placed as well as movement between surveys. This is a draft copy of this map and will be replaced in final version.
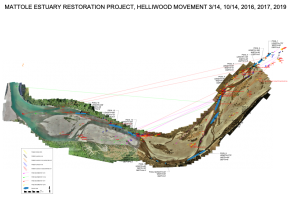
FIGURE 8 – LARGE WOOD MOVEMENT MAP
Flight Mission Planning
My workflow involves a multi-step process using a few different apps. Flight mission planning and image acquisition is done with Pix4D Capture using a DJI Phantom 4 Pro V2.
Post image processing and dense point cloud are created with Agisoft MetaShape Pro. Final maps are produced using QGIS on a Mac.
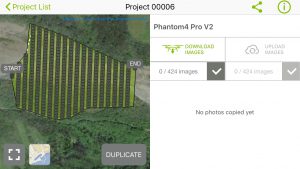
Sample Flight Mission Plan in Pix4D Capture
Photo Gallery