Spawner Surveys
The Mattole Salmon Group (MSG) has conducted annual spawning ground surveys in selected mainstem and tributary reaches in the Mattole River watershed for 33 consecutive seasons, from 1981-82 through 2013-2014. Data are used to track long-term trends in escapement and spawner distribution for fall-run Chinook salmon (Oncorhynchus tshawytscha) and coho salmon (O. kisutch). Some data are incidentally collected on Steelhead (O. mykiss).
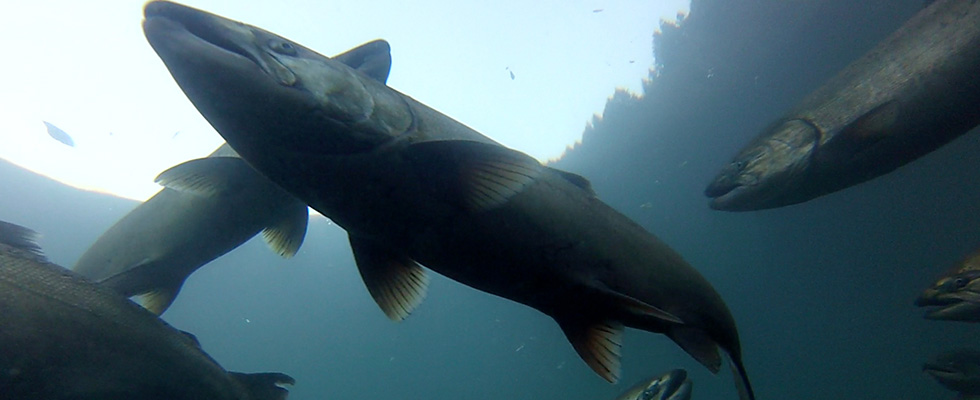
Mattole Chinook in the lower river (2014). Photo credit Vincent DiMarzo.
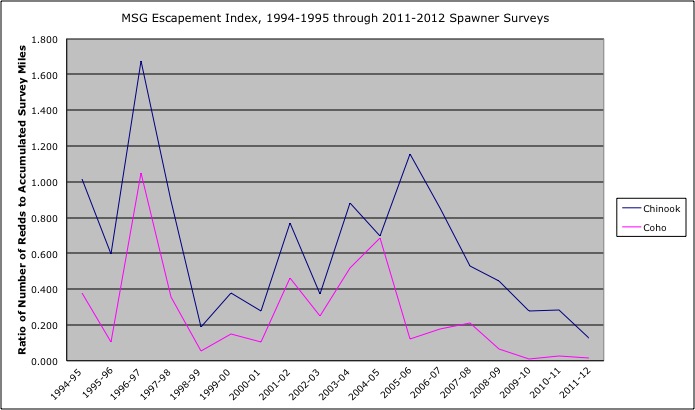
Prior to 2012, the MSG utilized an Escapement Index (EI) as its primary method of evaluating spawner populations from year to year. The Escapement Index is the number of redds for a given species divided by the accumulated miles surveyed for a particular watershed unit. The EI allowed us compare survey seasons with varying amounts of survey coverage (total miles surveyed) and survey effort (accumulated miles surveyed), in order to correct for variations between years.
For the 2012-2013 survey season, the MSG adopted the Department of Fish and Wildlife’s California Coastal Monitoring Program spawner survey method (Garwood and Ricker 2011). This method allows us to be consistent with other watersheds in the California Coastal Monitoring Program as well as make a statistically valid population estimates for Mattole coho and Chinook salmon.
This method entails conducting repeated periodic surveys in a spatially balanced random (also called Generalized Random Tesselation Stratified (GRTS)) sample of stream reaches selected from possible anadromous spawning stream reaches within the Mattole River, Humboldt and Mendocino Counties, California.
2014-2015 Spawner Surveys
Check out our latest News post.
2013-2014 Spawner Surveys
Redd population estimates and the final report for the Mattole River from the 2013-2014 winter season are not yet available from DFW.
A summary of 2013-2014 spawner surveys by Michelle Dow, MSG surveyor:
Because low flows inhibited salmon from migrating upriver past the Honeydew Slide for the majority of the 2013-14 Chinook spawner season (thus making it pointless to survey the GRTS-selected reaches in the headwaters), the MSG decided to implement a full Chinook census of the lower river. Crews surveyed reaches from the confluence of Honeydew Creek to Stansberry Creek, just above the estuary.
The upshot of the census is that, from what we could tell, there appear to have been more than 353 Chinook that returned to the Mattole River to spawn last winter. We know this because during the single week that we saw the most live Chinook (January 3-9, 2014), 353 is the number of live Chinook seen that week plus the number of Chinook carcasses that had already been counted previously. There were certainly more Chinook, total, in the Mattole throughout the entire season, but this is a minimum that avoids double-counting the same fish across multiple weeks.
The highest concentration of redds observed were between the Petrolia bridge and Mill Creek and from the Lindley bridge to Conklin Creek.
The peak of Chinook spawning occurred from mid-December to mid-January – a slightly later peak compared to previous years, because the fish held out waiting for rains. There were only a handful of Chinook left to make the journey upriver when the February rains arrived, and the furthest upriver observations of live Chinook were between Big Finley Creek and the Ettersburg bridge.
This winter’s low flows posed challenges for Chinook and survey crews alike. The majority of Chinook were stuck below the Honeydew Slide and were forced to spawn in lower-river riffles where much superimposition occurred. (Superimposition is the term used to describe what happens when fish spawn on top of one another: a redd dug partially or completely on top of a pre-existing redd; it is believed to reduce viability among the eggs in the initial redd.) Whole riffles in the lower river were worked over and stocked full of redds and live fish.
While spawning in the lower river – where redds are more vulnerable to high flows and turbidity – certainly isn’t ideal, we observed that some redds were dug in larger cobbles and boulders, which should offer more protection during high flows. The broadness of the lower river valley and lack of subsequent large flow events over 20,000 cfs could have been favorable for the success of redds and juveniles. This past spring, the lower river was most likely considerably crowded with juvenile Chinook (indeed snorkelers occasionally noted high concentrations of juvenile
Chinook in the lower river in May.) Whether many of these fish perished due to fierce competition for limited resources or opted to outmigrate to the sea remains unknown. With the fate of global warming upon us, bringing more erratic weather patterns, habitat enhancement of the lower river is critical to ensure survival of large numbers of juveniles.
Mattole coho salmon – with their tendency to arrive and spawn slightly later in the season – seem to have weathered the winter drought a little luckier than Chinook. (Although given their recent numbers, it’s hard to be very optimistic about Mattole coho.)
The winter of 2013-14 was an odd one. When comparing the hydrographs from this year to last year (which was more typical), it is evident that the storms this winter occurred much later than they typically do, with the largest storms in February through April compared to November through February. It’s uncertain if this year was just a blip or a herald of more strangeness to come. Certainly within their 6 million years of evolution, salmon have encountered many landscape and climatic changes, but with later rains and less annual precipitation changing spawning behavior and selection, lower-river habitat may become paramount to the success and vitality of the Mattole salmon runs.
2012-2013 Spawner Surveys
Abstract (Ricker et al. 2014):
A total of 143 salmonid spawning ground surveys were conducted in 23 randomly sampled stream reaches throughout the Mattole River basin between 11/24/2012 and 02/28/2013. Individual stream reaches were surveyed an average of 6 times over the study period with an average return interval of 15 days between surveys. Field staff observed 5 coho salmon, 481 Chinook salmon, 1456 steelhead trout and 200 unidentified live fish over the survey period. A total of 6 coho salmon, 386 Chinook salmon and 78 unknown individual salmonid carcasses were found. Field surveyors were able to assign species to 70 of the total 405 redds observed. After all unidentified redds were predicted to species likely to have built them, we estimated the total number of redds constructed across all reaches in the sample frame, expanded from the randomly sampled reaches to be 373 Chinook salmon, 39 coho salmon, and 402 steelhead. In the 2012-13 season 2 known coho redds were observed, but 39 coho redds were predicted. The spawning ground survey period did not encompass the entirety of the spawning period for steelhead, and therefore the estimates for steelhead presented herein should be considered to represent only the time period encompassed by the length of the study.
References:
Adams, P., L. Boydstun, S. Gallagher, M. Lacy, T. McDonald and K. Shaffer. 2011. California coastal salmonid population monitoring: strategy, design, and methods. State of California, Fish Bulletin 180.82p.
Garwood, J., and S. Ricker. 2011. Spawner survey frame development for monitor- ing adult salmonid populations in California. California Department of Fish and Game. Annual Report. 50 Ericson Ct., Arcata, CA. 18 p.
Ricker, Lindke, and Thompson. 2014. California Coastal Monitoring Program Annual Report: Results of regional spawning ground surveys and estimates of total salmonid redd construction in Mattole River, Humboldt and Mendocino Counties California, 2012. State of California Department of Fish and Wildlife. Arcata, CA.: